

A clearance markdown strategy starts with three decisions: which stock must leave, by what date, and how much cash each possible price plan can recover. Work backward from the deadline, compare several price steps with keeping the current price, and arrange an exit for anything left over. A discount percentage alone is not a clearance plan.
This guide focuses on a finite inventory lot that needs to leave within six weeks. The decision is about stock exit and recovery by a date; temporary promotions require a separate evaluation of campaign performance. If you are still deciding which items need intervention, start with identifying deadstock.
Key Takeaways
- Set a deadline and an acceptable remaining quantity before choosing the discount.
- Compare price schedules using explicit sales assumptions, including a weaker-demand scenario.
- Count the net value of leftover stock and the costs of selling or disposing of it.
- Review remaining units against the time left. Change the plan while another price step or exit route is still possible.
Jump to the plan inputs, six-week example, recovery calculation, or review checkpoints.
What Is Markdown Pricing? Markdown vs Promotional Pricing
Markdown pricing means reducing an item’s selling price. In clearance, the purpose is to move a defined quantity before a season ends, an assortment changes, or another deadline arrives. The important distinction is the objective; the word “markdown” does not mean every reduction must be permanent.
A temporary campaign can also lower the price, but its success may depend on demand and contribution beyond what would have happened without the offer. A clearance plan has a different operational test: how much of the specified lot will remain when its selling window closes?
| Decision | Clearance markdown | Temporary promotion |
|---|---|---|
| Starting problem | A defined inventory lot must exit by a date | A campaign seeks a change in customer purchasing |
| Price planning | Compare levels and timing against the units remaining | Choose offer terms around the campaign objective |
| Essential review | Residual stock, recovery, and deadline risk | Campaign economics and effects beyond the discount window |
For the campaign calculation, use the separate guide to evaluating promotional pricing. Here, the calculation follows one inventory lot through its remaining selling window and final exit.
How to calculate markdown percentage
Markdown percentage measures the price reduction relative to the original selling price:
Markdown % = ((Original Price − New Price) ÷ Original Price) × 100
For the stepped plan below, the original price is $100. Keep that starting price as the denominator when calculating the cumulative markdown at each stage.
| New price | Calculation from the original $100 price | Cumulative markdown |
|---|---|---|
| $80 | (($100 − $80) ÷ $100) × 100 | 20% |
| $70 | (($100 − $70) ÷ $100) × 100 | 30% |
| $60 | (($100 − $60) ÷ $100) × 100 | 40% |
An additional cut between stages uses the previous stage’s price as its base. Moving from $80 to $70 is a 12.5% additional reduction: (($80 − $70) ÷ $80) × 100. Moving from $70 to $60 is approximately 14.3%: (($70 − $60) ÷ $70) × 100. Each move adds 10 percentage points to the cumulative markdown from $100; neither is an extra 10% off the previous selling price. Record which price is the denominator whenever you describe a markdown level.
Fix the inventory lot, deadline, and current-price scenario
Start with saleable units at the variant and location level you can actually price. Remove damaged, reserved, or otherwise unavailable stock from the clearance quantity. Reconcile transfers and expected arrivals, and decide whether replenishment will stop. A plan for a fixed lot breaks if fresh stock keeps entering unnoticed.
Define what the deadline means. “End of week six” could mean sold to customers, dispatched from the warehouse, or physically removed through a secondary buyer. Those are different checkpoints. If a buyer needs two weeks to arrange collection, week six is too late to start that conversation.
The following example uses one hypothetical 300-unit lot. All amounts are in USD, exclude tax, and assume no replenishment, returns, or inventory losses. The deadline requires zero units remaining after retail sales and any agreed secondary exit.
| Planning input | Illustrative assumption |
|---|---|
| Starting saleable inventory | 300 units |
| Current retail price | $100 per unit |
| Retail selling window | Six weeks |
| Retail sales at the current price | 20 units per week |
| Previously paid inventory cost | $55 per unit; $16,500 for the lot |
| Future variable retail selling cost | $8 per unit sold |
| Additional cost of either markdown plan | $400 for the full event |
| Secondary exit for unsold units | $12 net per unit, with capacity for the remaining lot |
At the unchanged $100 price, the assumed six-week retail sales are 120 units. That leaves 180 units needing another exit. To sell all 300 units through retail alone would require an average of 50 units per week.
This current-price scenario is a planning reference. It does not establish that a later increase in sales was caused by the markdown. Check whether the assumed rate still fits the season, available sizes, traffic, and remaining selling days.
Compare three six-week clearance price plans
Clearance markdown optimization compares allowed price levels and their timing against a stock target, a deadline, and the cash each plan can recover. A mild reduction introduced early gets more selling time; a deep reduction can clear stock faster while collecting less per unit. Neither outcome can be inferred from the discount alone.
For this markdown pricing example, use three assumed demand schedules:
- Hold: $100 throughout, with 20 retail units sold each week.
- Stepped: $80 in weeks 1–2, $70 in weeks 3–4, and $60 in weeks 5–6; assume weekly sales of 40, 40, 50, 50, 60, and 60 units.
- Deep cut: $50 from week one; assume demand for 70 units per week while stock is available. Actual sales are capped by remaining inventory.
These are constructed scenarios, not measured price responses or a SkuPeek forecast. The example assumes all three schedules are permitted. In a real plan, apply your approved price floor, channel restrictions, fulfillment capacity, and limit on price changes before comparing results. Broader objective-setting belongs in price optimization.
This comparison identifies the best of the three plans considered under the stated assumptions. It does not establish a mathematically optimal price path across every allowed price, timing choice, and possible demand trajectory.
The stepped plan, week by week
Each week’s retail recovery equals that week’s selling price multiplied by units sold. It is revenue before selling costs. Opening inventory minus sales gives closing inventory under the example’s no-return, no-arrival assumptions.
| Week | Opening units | Price | Assumed units sold | Closing units | Retail recovery |
|---|---|---|---|---|---|
| 1 | 300 | $80 | 40 | 260 | $3,200 |
| 2 | 260 | $80 | 40 | 220 | $3,200 |
| 3 | 220 | $70 | 50 | 170 | $3,500 |
| 4 | 170 | $70 | 50 | 120 | $3,500 |
| 5 | 120 | $60 | 60 | 60 | $3,600 |
| 6 | 60 | $60 | 60 | 0 | $3,600 |
| Total | 300 initially | Three levels | 300 | 0 at deadline | $20,600 |
The hold plan finishes the retail window with 180 units. The deep cut sells 70 units in each of its first four weeks, then the last 20 in week five. It reaches zero earlier, but its retail recovery is $15,000.
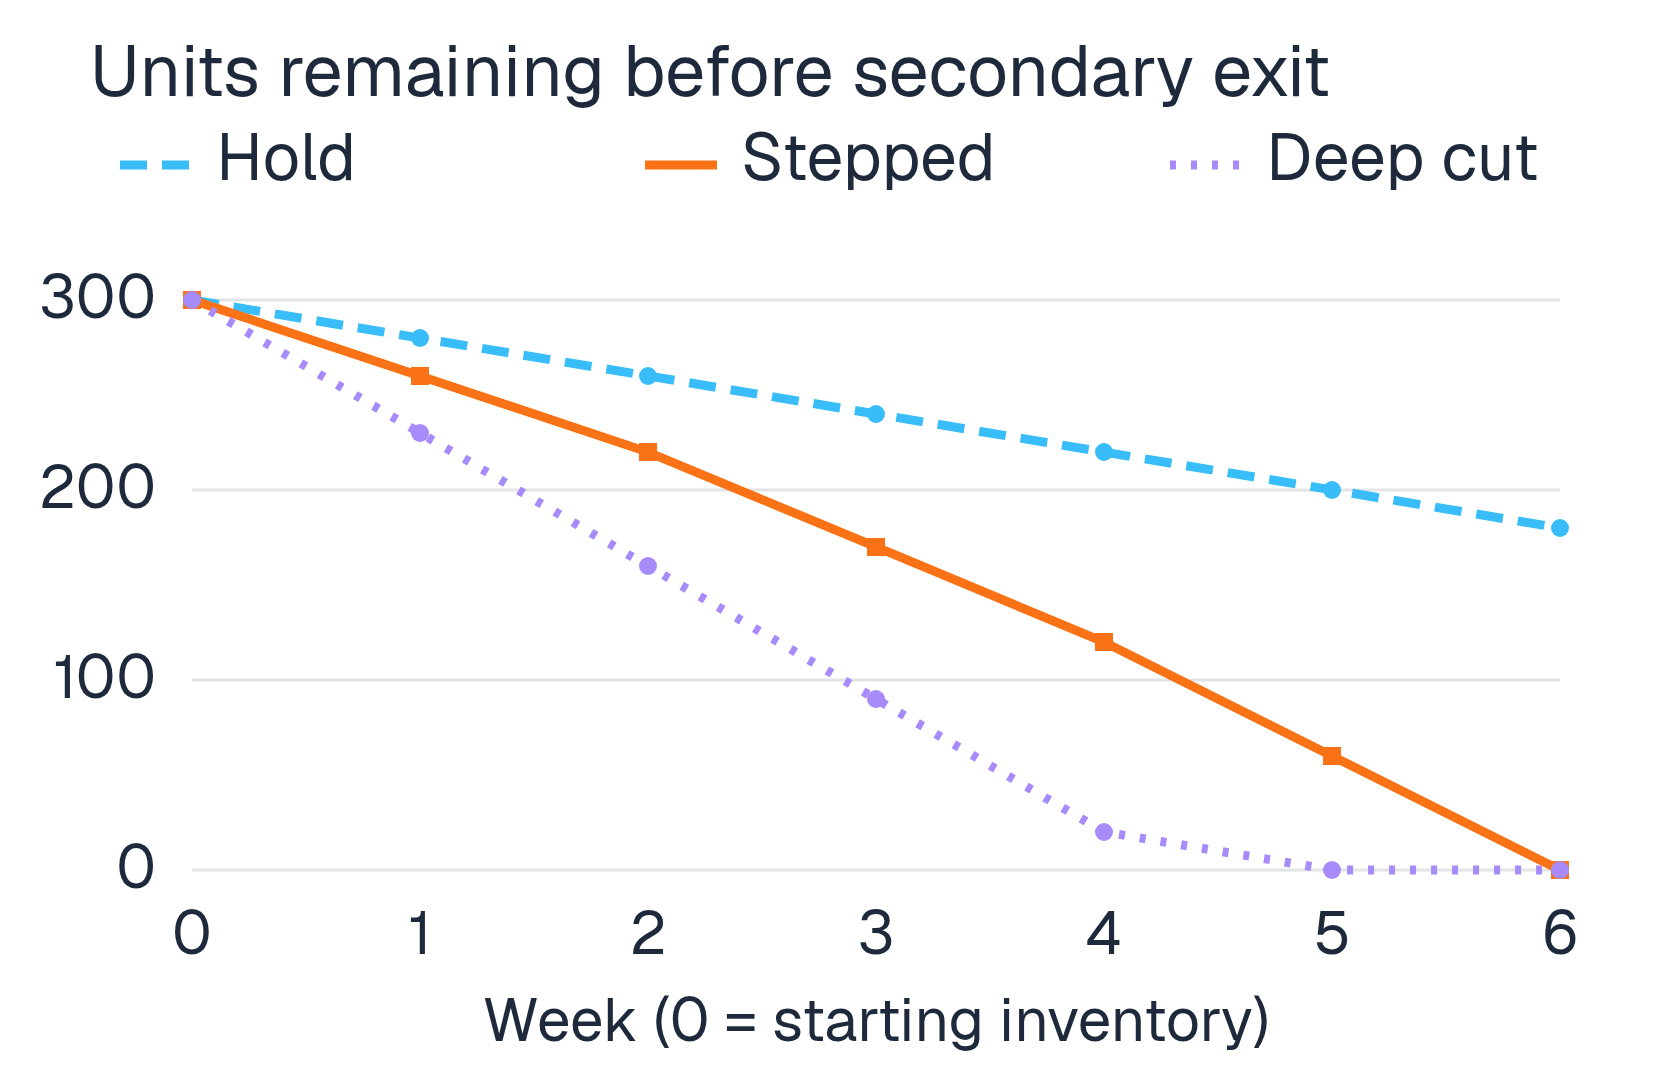
The stepped plan collects more retail revenue in these assumptions. That makes it a candidate for approval, subject to costs and demand risk. It does not make $80 → $70 → $60 a universal markdown ladder.
Include the net value of stock left at the deadline
Remaining stock has an economic outcome even when it misses the retail target. A secondary buyer might pay for it; storage, removal, or disposal might instead cost money. Use the actual alternative and its timing, rather than valuing every unsold unit at zero or at its former retail price.
In this example, a secondary buyer is assumed to take all remaining units by the deadline for $12 net per unit. That amount is already after the exit route’s handling and transport costs. It is a planning input, not a market quote. Do not subtract those same costs again.
For this lot, compare future net cash recovery as:
Net cash recovery = retail receipts + net proceeds from remaining stock − future retail selling costs − additional markdown costs.
| Six-week plan | Retail units sold | Units needing secondary exit | Retail receipts | Net exit proceeds | Future retail and markdown costs | Net cash recovery |
|---|---|---|---|---|---|---|
| Hold at $100 | 120 | 180 | $12,000 | $2,160 | $960 | $13,200 |
| Stepped $80 → $70 → $60 | 300 | 0 | $20,600 | $0 | $2,800 | $17,800 |
| Deep cut to $50 | 300 | 0 | $15,000 | $0 | $2,800 | $12,200 |
The stepped plan’s $2,800 comprises $2,400 of variable selling costs and $400 of event costs. The deep cut has the same assumed costs. Holding the price incurs $960 of retail selling costs and no markdown event cost.
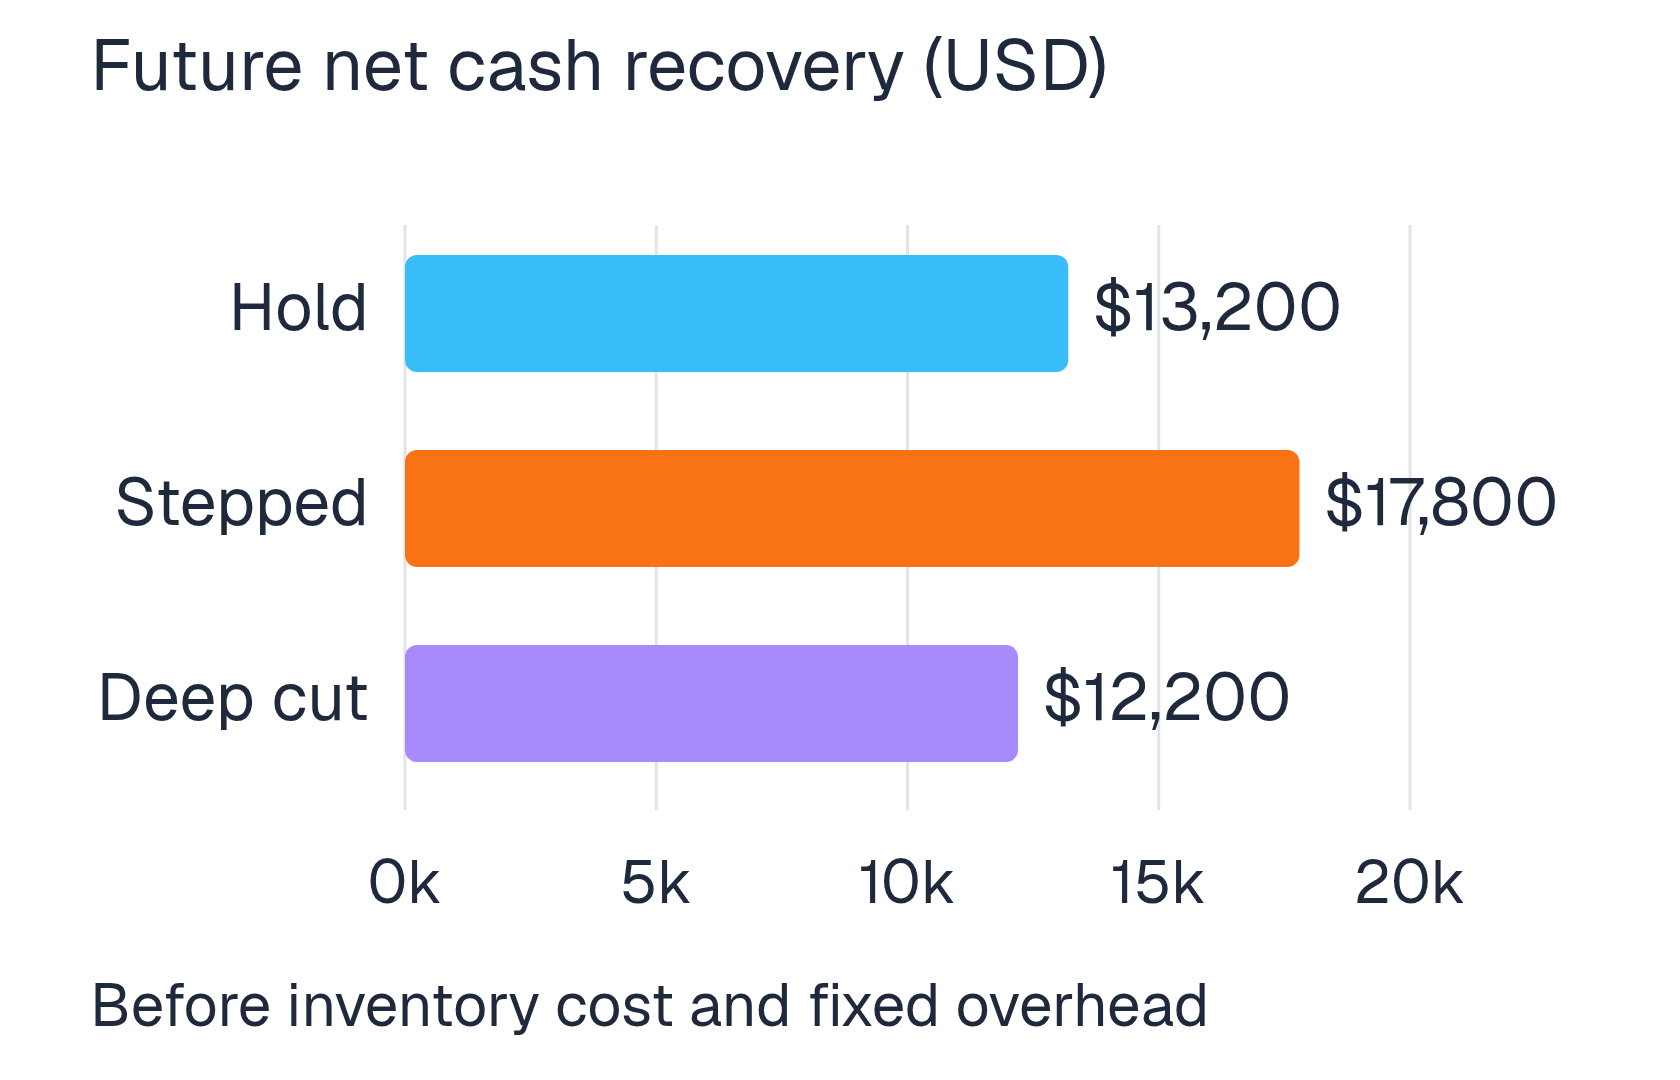
Clearing everything fastest does not produce the most cash in this example. The deep cut returns $1,000 less than holding the retail price and exiting the remainder. If earlier cash or warehouse capacity has value, include it explicitly; this simple comparison does not discount cash flows or price the space released.
Cash recovery is not profit. The $16,500 inventory purchase has already been paid and is the same across these three complete exit plans. For a simple full-lot comparison, subtracting it from the stepped plan’s $17,800 leaves $1,300 before fixed overhead and any omitted costs. Do not deduct the purchase twice. Use contribution margin for the wider cost classification.
Stress-test demand and the secondary exit
Reduce the stepped plan’s assumed sales by 20% at every stage: weekly sales become 32, 32, 40, 40, 48, and 48 units. Retail sales total 240 units, receipts are $16,480, and 60 units remain. With the $12 net exit, recovery is:
$16,480 + $720 − $1,920 − $400 = $14,880.
That is $2,920 below the stepped plan’s base case. It still depends on the buyer taking the remainder. If those 60 units have zero net exit value, recovery falls to $14,160. If removal costs money, it falls further.
Confirm capacity, accepted condition, minimum lot size, transport responsibility, and the latest booking date before treating a secondary exit as available. An unconfirmed offer does not solve a hard warehouse deadline.
Set checkpoints before another cut becomes too late
At each review, calculate the average selling pace still needed:
Required weekly retail sales = (remaining saleable units − allowed retail residual) ÷ retail selling weeks left.
Use an allowed retail residual of zero if all stock must sell to customers. If some units can leave through a confirmed secondary route, state that quantity separately. Keep the retail target and the final warehouse target distinct.
Under the stepped base case, 220 units remain after week two. With four weeks left and no planned retail residual, the required average is 55 units per week. The planned rates of 50, 50, 60, and 60 meet that requirement exactly, leaving no buffer.
Suppose only 60 units sell in the first two weeks. There are now 240 units left, requiring 60 per week. The unchanged later schedule sells only 220, leaving 20 at the retail deadline. That is a reason to reconsider timing, assumptions, or the secondary exit while there is still time to act.
| Checkpoint | Question | Decision to record |
|---|---|---|
| Before week 1 | Do the price levels and exit route fit the constraints? | Approved ladder, spending limit, owner, and backup route |
| End of week 2 | Can the remaining schedule still reach the retail target? | Keep, advance, or revise the next step using updated assumptions |
| End of week 4 | Is the final price stage enough, and is collection booked? | Final retail action and confirmed arrangements for residual stock |
| End of week 6 | What actually sold or left, and what remains? | Reconciled quantities, recovery, and unresolved units |
Review earlier if sales stop, the assortment becomes incomplete, or the price change fails to reach the storefront. These checkpoints are an example schedule. Shorter selling windows need faster decisions.
If no allowed price is likely to meet the required pace, flag the plan as infeasible under the current assumptions. Arrange another exit or revise the deadline with its owner. Repeated cuts cannot guarantee demand.
Verify the price customers can actually buy
Check each affected variant on the product page, collection page, and in the cart or checkout for the target market. Record the price that applies after any overlapping discounts. A spreadsheet can show the approved level while the customer still sees a different one.
In Shopify, Price sets the sale price and a higher Compare-at price can show a reference price. How the comparison appears depends on the theme, and fixed market pricing can override the admin values. A populated Compare-at field does not establish that the reference was a genuine previous price or that the comparison is valid in the selling market.
Keep competitor prices as context for your demand assumptions. Compare the same product, variant, condition, and delivery terms, with a recent observation date. Public “in stock” labels do not reveal competitors’ warehouse quantities or how quickly their stock is selling. A competitor price monitoring schedule helps keep that context current.
Your own orders, inventory movements, and costs must drive the clearance checkpoints. A competitor’s price change is a reason to review an assumption, not evidence that your lot will clear at the same price.
Track recovery and residual stock together
Close each review with units remaining, realized selling prices, future costs, and the revised exit requirement. Revenue alone cannot show whether the lot is on course to leave by the deadline.
For the fixed lot in this example, cohort sell-through is retail units sold divided by the initial 300 units. The stepped plan reaches 26.7% after week two and 60% after week four. Label this measure explicitly; it is tied to this lot rather than a rolling replenished inventory pool. Report secondary exits separately from retail sales.
If you use Shopify inventory reports, check their own denominator, reporting period, and data delay. Its days-of-inventory estimate uses recent average daily sales, including a 28-day sales basis. That estimate is not a clearance deadline forecast and cannot establish demand at a price you have not yet tried.
| Review measure | What to record |
|---|---|
| Saleable units remaining | Variant-level balance reconciled with orders, returns, and adjustments |
| Retail sell-through | Retail units sold from the defined lot, with the denominator stated |
| Realized retail receipts | Actual selling prices after applied discounts and refunds |
| Net recovery to date | Receipts less costs already incurred, with future exit value shown separately |
| Deadline exposure | Units still needing retail sales or a confirmed alternative exit |
At the end, reconcile the original lot into retail units retained by customers, secondary exits, losses, and any remaining inventory. Revisit returns and unsettled fees before calling the recovery final. Do not count a promised buyout as collected cash.
The next markdown decision should have four things attached: remaining units, time left, an approved price, and a revised recovery calculation. If one is missing, resolve it before the next cut goes live.